ABSTRACT
The bearing system is one of the most critical parts for the proper functioning of an internal combustion engine. Even though failures of sliding bearings rarely occur, serious consequences such as complex crankshaft repair causing long engine downtime must be considered. Condition monitoring approaches have the potential to prevent critical operating conditions caused by bearing wear and failure. Early detection of an anomaly is key because the available reaction time for appropriate countermeasures, such as engine derating or shutdown, is typically in the range of seconds in the event of an impending bearing system failure. With high-speed and medium-speed engines requiring approximately 10 to 60 seconds from nominal speed to standstill, simple state-of-the-art monitoring algorithms relying on fixed limit values such as maximum permissible bearing temperature may detect an emerging bearing failure too late to avoid serious engine damage. The goal of this paper is therefore to investigate advanced bearing condition monitoring approaches consisting of reliable measurement parameters that provide significant information about the status of the bearing in combination with sophisticated concepts for diagnosis. Investigations on a bearing test rig as well as on a test engine that involve various monitoring parameters serve to create a comprehensive experimental database. With the measurements on the bearing test rig, several bearing monitoring parameters are evaluated and discussed with regard to their significance and their intercorrelation structure, in particular when bearing failures are provoked. Based on the knowledge obtained on the bearing test rig, selected advanced measurement parameters will be investigated for their suitability under real-life conditions in a multi-cylinder test engine. Relying on a currently available measurement database, the usage of appropriate data-driven approaches from the field of machine learning for the purpose of real-time prediction of bearing temperature as a function of the engine operating conditions during failure-free operation is presented. Such a model can serve as a reference for condition monitoring to diagnose even small deviations from the expected bearing system behavior and to initiate corresponding countermeasures in a timely manner. As an outlook, potential steps to further improve bearing condition monitoring systems are discussed and how predictive maintenance approaches could be built upon them.
1 INTRODUCTION
The bearing system is one of the most critical parts for the proper functioning of an internal combustion engine (ICE). Even though failure of sliding bearings rarely occurs, it can lead to serious consequences, such as complex crankshaft repairs that cause long engine downtimes. Condition monitoring (CM) approaches have the potential to prevent critical operating conditions brought about by bearing wear and failure \(1–5\).
Early detection of an anomaly is key because the available reaction time for appropriate countermeasures, such as engine derating or shutdown, is typically in the range of seconds in the event of an impending bearing system failure. Since high-speed and medium-speed engines require approximately 10 to 60 seconds from nominal speed to standstill, simple state-of-the-art monitoring algorithms relying on fixed limit values such as maximum permissible bearing temperature may detect an emerging bearing failure too late to avoid serious engine damage. The goal of this paper is therefore to investigate advanced bearing CM approaches consisting of reliable measurement parameters that provide significant information about the status of the bearing in combination with sophisticated concepts for diagnosis.
Section 2 starts by elaborating the principles and theories concerning the functionality of sliding bearings. This serves as the basis for a detailed examination of friction power loss as a key bearing failure mechanism. Specific measurement parameters and related sensor concepts that are considered useful for detecting incipient bearing system damage are presented and explained. Building on these theoretical considerations, Section 3 deals with experimental investigations that test the sliding bearing-related measurement technology under defined laboratory conditions on a sliding bearing test rig. The results obtained provide a deeper understanding of how each measurement technology behaves and what effort is required for instrumentation and data processing. The use of standardized test programs ensures that test conditions are reproducible and enables direct comparison of measurement technologies (as well as indirect comparison of measurement technologies that could not be measured at the same time, e.g., due to different insulation requirements on the bearing surface). Based on this knowledge and all correlations, the most promising measurement technologies will be further investigated on real engines. However, the bearing test rig investigations also allow the most promising technologies to be compared and
correlated with other measurement technologies not found to be feasible for real-world bearing CM.
Section 4 describes experimental investigations on real engines. Due to restrictions with regard to available design space and effort taken for instrumentation, only selected measurement technologies are employed. The potential of data analytics approaches to analyze the data and build reference models for further CM usage is demonstrated.
Section 5 presents business considerations of additional/novel bearing CM monitoring equipment. Finally, Section 6 provides an outlook.
2 PRINCIPLES AND THEORIES
One general comment is important to consider
before bearing functionalities and failure modes are
explained: The comparison of slide to roller
element bearings (REBs) is made to provide a
better understanding of some basic principles and
to illustrate some major differences and challenges
especially with regard to bearing failure initiation
and propagation. As for the basic load capability
potential, the assembly space in combination with
the assembly situation within large bore multicylinder
engines (MCEs) there is practically no
alternative to slide bearing installations for the main
bearings (MBs) and big end bearings (BEBs).
However, the timely detection (before major engine
damage) of slide bearing failures is tricky, as will be
explained in the following sections.
2.1 Bearing condition monitoring process
According to standard EN 13306:2017 on maintenance 66, CM is defined as the “activity, performed either manually or automatically, intended to measure at predetermined intervals the characteristics and parameters of the physical actual state of an item”, where item refers to a “part, component, device, subsystem, functional unit, equipment or system that can be individually described and considered.”
In accordance with the CM definition above, the monitoring process for sliding bearings (or any other engine component) further involves condition detection to acquire parameters that reflect the condition of the bearing, condition comparison to evaluate them against a reference condition, and diagnosis to identify the type and location of failures and enable early maintenance action 77.
EN 13306:2017 66 also categorizes different types of maintenance that apply to bearing systems as follows: Corrective maintenance and preventive maintenance differ in whether actions are taken
after or before a bearing failure. Within preventive maintenance, predetermined maintenance and condition-based maintenance (CBM) differ in whether the degradation of the bearing condition is monitored. When CBM includes a prognosis of the future condition of the bearing, it becomes a predictive maintenance (PdM) strategy.
For development of new or improvement of existing bearing CM and maintenance strategies, several condition detection approaches (i.e., measurement systems) are available that may (slightly) differ in the failure mechanism that is monitored.
2.2 Principles of hydrodynamics and rolling contact
The bearing test rig, the engine systems and machine learning algorithms, the fundamental functionality of sliding bearings and the differences to rolling element bearings (REB) are addressed prior to an in-depth discussion of measurement systems.
2.2.1 The hydrodynamic principle
A hydrodynamic bearing system in an ICE generally consists of three parts: the shaft, the bearing (mounted in a housing) and the lubricant. Based on the physics of fluid dynamics (Navier stokes and continuity equation), the wedge (rotation) and the squeeze effect as shown in Figure 1 are responsible for the proper functionality of the bearing system, allowing the shaft separation from the bearing.
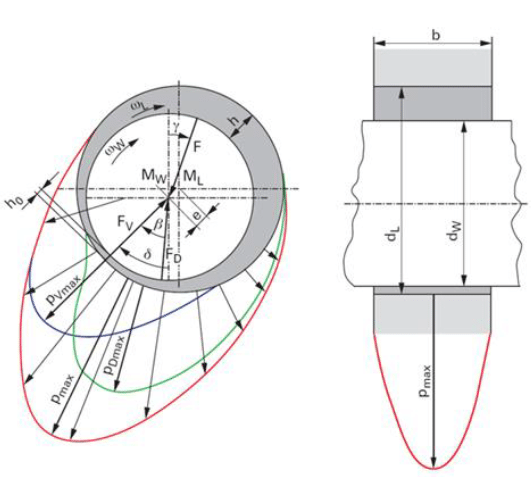
Figure 1. Hydrodynamic principle of rotation and squeeze effect [8]
The squeeze effect is only present if dynamic loading occurs. Concerning the rotation, the Stribeck curve shown in Figure 2 illustrates how the friction coefficient is related to the rotational speed.
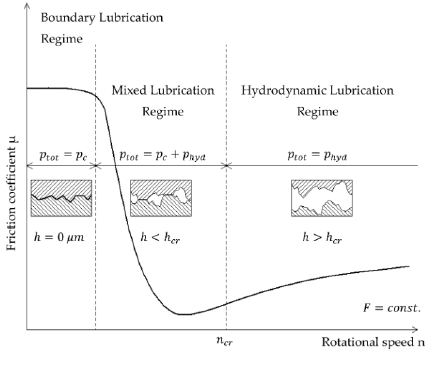
Figure 2. Stribeck curve with different lubrication regimes [9]
The friction force acting in the rotational direction is defined in Equation 1. It is the sum of the shear pressure/stress in the oil under full hydrodynamics or hydrodynamics in combination with the asperity contact shear stress in case of mixed friction behavior.
FR = μ Fn (1)
As the shear acts within the lubrication film, the fluid properties of the oil are essential for the level of the friction forces and subsequently for the friction power loss of a hydrodynamic bearing system. The relations are explained in Equations 2 to 5 and illustrated in Figure 3.
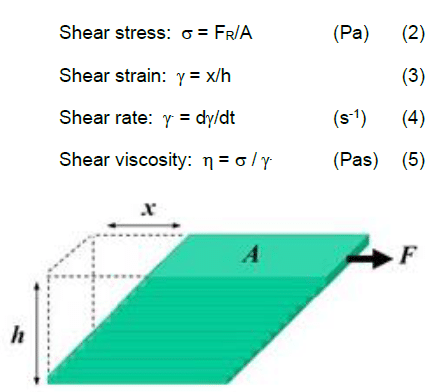
Figure 3. Relation of shear force to shear strain [8]
in the event of mixed friction occurrence, the shear forces due to the asperity contact pressure have to
be added to the shear forces by pure hydrodynamics, see also Equation 6.
FRT = FR + FRA (6)
2.2.2 Rolling contact
To better illustrate the challenges in “early” detection of bearing failures working on hydrodynamics, the rolling contact and its failure mechanism are described. The information on REBs used in this section including Figure 4 has been extracted from [10].
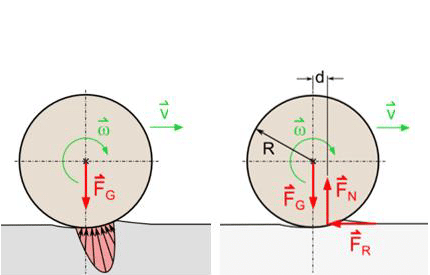
Figure 4. Rolling contact
FRT = cR Fn (7)
Rolling resistance arises because both the rolling body and the surface deform as rolling occurs. Although this deformation is elastic, there are also processes that cause a loss of energy. Amongst others there is a sliding part of the rolling motion for the eccentric roll which induce fulling work or plastic deformation in the ground. The rolling resistance coefficient (cR) indicates the relation between the loading force and the friction force (see Equation 7), similar to Equation 1 for sliding bearings. Besides load and speed, the main contributor to the friction force level is the fluid viscosity in the case of slide bearings and the material and geometry of the rolling elements and outer and inner ring in the case of a rolling contact.
2.2.3 Friction power loss
The friction power loss of both a hydrodynamic and a rolling contact is defined as the shear/friction force times the relative sliding velocity as deduced from Equation 8.
PR = vFRT (8)
Changes in friction power loss will be important specifically during the description of the failure mechanism in the following subsection.
2.3 Bearing failure mechanism
2.3.1 Hydrodynamic sliding bearing failure mechanism
The main driver for sliding bearing failure is an increase in friction power loss. For all further considerations, a correct bearing layout, i.e., a correct bearing clearance and an adequate viscosity level for the specific application boundaries is required, which results in generally robust functionality of the (bearing) system.
In all these cases, failure occurs “only” as a result of increased mixed friction/asperity contact pressure. Equation 9 and Figure 5 describe the relations defining thermal stability.
PQ + PH > PR + (Pext) (9)
Thermal stability is a given as long as the friction power loss PR “produced” is smaller than the sum of heat conduction PH (via the shaft and housing) and the heat transfer by the oil cross flow PQ, which is dependent on the heat capacity of the lubricant (neglecting heat radiation and external heat sources).
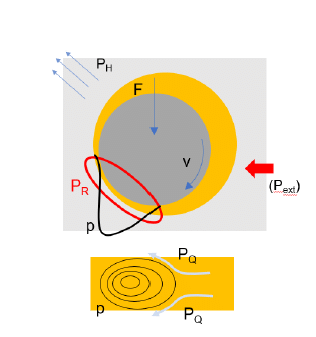
Figure 5. Principle of the heat transfer of a hydrodynamic sliding bearing, equation 9
An increase in friction power loss may be initiated due to particle ingress, oil starvation, material fatigue, excessive overload, or excessive misalignment. This causes a system temperature increase which correlates with a reduction in the oil film thickness h as described in Figure 2 due to the temperature dependent lubricant viscosity decrease (Figure 6); the result is intensified mixed friction behavior.
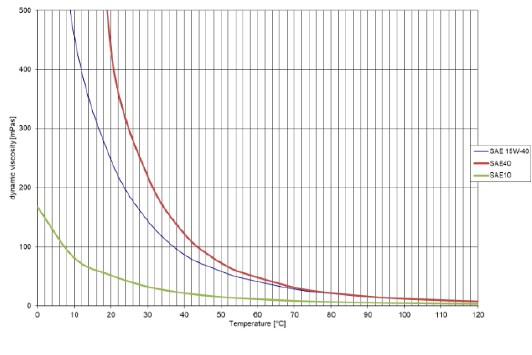
Figure 6. Temperature-dependent dynamic viscosities of single-grade and multigrade SAE oils
This positive feedback loop eventually leads to a seizure event due to thermal instability. As the mixed friction coefficient is 10 to 20 times higher than pure hydrodynamic shearing (see Figure 2), the damage propagation only takes a few seconds under typical engine load and speed conditions. The test rig recorder data and pictures of new and failed bearing shells will be shown in Section 3.
2.3.2 Roller element bearing failure mechanism and detection methods
In contrast to hydrodynamic sliding bearing failure, the effect on a roller element bearing (REB) is somewhat similar with regard to initiation (dirt ingress, oil starvation, fatigue, misalignment, etc.) but quite different in terms of failure propagation. Even if the overall friction power loss of REBs and hydrodynamic sliding bearings are in the same range under stable working conditions, the change in this friction power loss in the event of starting bearing failure is different. The rolling resistance coefficient cr (cf. Section 2.1.2.) stays constant as long as the geometry and the material integrity of the whole system is given. For significant disturbance of the rolling by the effects described, a relatively long-term time frame of days, weeks, or sometimes a month is needed.
In addition, REBs normally have their characteristic NVH (noise, vibration, and harshness) signature depending on the type and dimension. Using this characteristic signature as the basis, abnormalities and beginning/propagating defects can be detected, by frequency spectrum analysis. Subsequent secondary failure can be avoided by employing adequate measurement systems in combination with in-time service.
2.4 Bearing-specific measurement systems
Oil film thickness as well as general bearing system status can be monitored in order to enhance knowhow and improve the detailed understanding of oil film behavior in addition to the standard control systems measurement equipment for evaluating oil film pressure. The following subsection describes the measurement principles and systems.
2.4.1 Oil film thickness by electrical impedance
The measurement equipment detects metal-to-metal contact events and relative oil film thickness by the electrical impedance principle without the need for integrating a sensor into the bearing.
Under mixed-friction conditions, the metallic surfaces of the shaft and the bearing sleeve are in direct contact. Under these conditions, the bearing is characterized electrically by a low resistance, as metallic components are in contact. Under hydrodynamic lubrication conditions, the metallic surfaces are separated by a thin film of lubricant. The electric resistance is high, and the bearing behaves like a capacitor. The capacitance decreases as the lubrication film thickness increases. The electric impedance of the bearing is the sum (or more precisely a parallel circuit) of its resistance and capacitance as shown in Figure 7.
Thus, the impedance gives information about the presence of metal-to-metal contact and about the thickness of the lubrication film. This is summed up in the kmix parameter, which describes the severity of mixed lubrication where 0 corresponds to continuous metallic contact and 100 to full hydrodynamic lubrication.
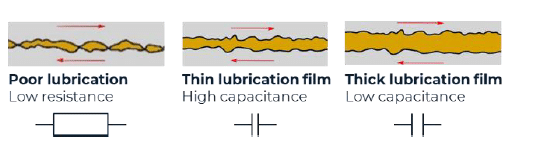
Figure 7. Electric behavior of lubricated contacts
The measurement is conducted by applying a contact brush to the shaft, isolating the bearing seat using an aluminum oxide coating, and applying a high-frequency signal to the bearing using a contact probe on the bearing sleeve. The documentation in this section has been provided by HCP Sense.
2.4.2 Oil film pressure monitoring
The oil film pressure can be measured with a piezoelectric sensor normally used for in-cylinder pressure measurement. As the occurring maximum pressures are ~10 times higher than the peak firing pressure, the Piezocryst H-series (Figure 8) with a pressure range up to 8000bar has been chosen.
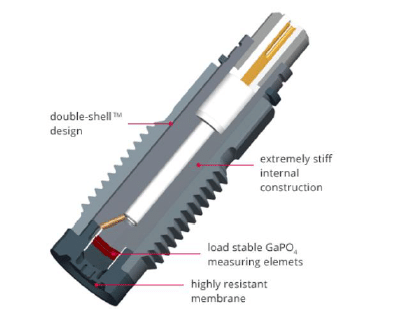
Figure 8. Piezocryst H-series sensor scheme [11]
A low “dead volume” and sufficient sealing is required to obtain adequate pressure measurements of the hydrodynamic film. Figure 9 provides a cross section of the sensor assembly for the bearing test rig set up.
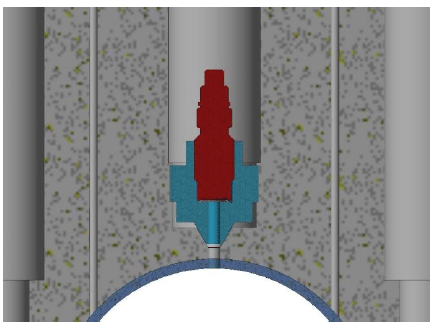
Figure 9. Rig assembly of the Piezocryst sensor (red) and sealing adaptor (blue)
Since the test rig bearing housing needs a deep bore for pressure measurement in the area with the highest load, an intermediate sealing adaptor was used for a proper installation.
2.4.3 Bearing sound emission
Oscillations resulting from irregularities or friction processes within the bearing can be identified through vibrations or acoustic signals. Such bearing sound emissions can be distinguished as vibrations and acoustic emissions (AE).
The former are characterized by signal frequencies up to 50 kHz and the latter by frequencies above that. Since the peak frequencies for bearing wear events usually occur at around 1100 kHz (adhesive wear) and between 250 and 1000 kHz (abrasive wear) [12], the following sensors have been chosen for bearing condition detection with AE measurements:
• Kistler 8152C
(frequency range of 100–900 kHz)
• Physical Acoustics MICRO-200HF
(frequency range of 500–4500 kHz)
• Qawrums W500
(frequency range of 100–1000kHZ)
Depending on the specific mounting conditions and accessibility of a sliding bearing in an ICE, AE sensors enable noninvasive and detailed detection of bearing condition. In addition, a basic correlation with other condition monitoring methods, such as oil film pressure measurement, can be assumed.
2.4.4 Mixed friction status detection
Interruption of the lubrication film by an operating state or defect will cause a temperature increase due to elevated friction power loss (see also subsections 2.1/2.2). Given the large mass of the rotating shaft, the bearing shell experiences a larger temperature increase, which induces an electrical voltage between the bearing shell and the rotating shaft due to the Seebeck effect. This voltage is detected by the BEAROMOS® device. The basic function is shown in Figure 10.
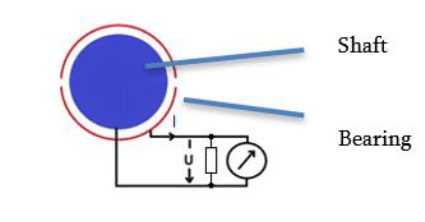
Figure 10. Measuring principle of the sensor
The sensor is contacted at the free shaft end with a customer-specific adaptation as shown in Figure 11. By contacting the shaft end on the outside of the machine housing, it is not necessary to interfere with the inside of the machine. The main information and Figure 10-11 within this section are based on Schaller’s BEAROMOS operating manual 183008.
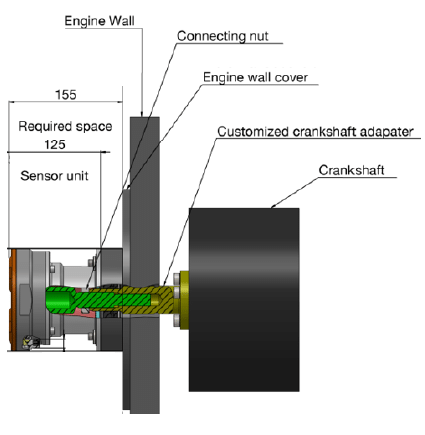
Figure 11. BEAROMOS sensor assembly CAD cross section
2.5 Data processing challenges
The different measuring systems for bearing condition monitoring present several challenges for data processing. While AE and oil film pressure monitoring are recorded at similarly high resolutions using a Yokogawa Scope-Corder, the oil film thickness and mixed friction condition measurements are (typically) obtained at comparatively low resolutions. While compressing and down sampling the AE and pressure signals make them directly comparable to the data from the lower-resolution methods, characteristic details of these measurement principles may be lost. In addition, achieving accurate measurement and event triggering for truly synchronized measurements, particularly for bearing wear and failure events, poses a significant challenge.
3 BEARING SYSTEM VALIDATION
As state-of-the-art large bore ICEs are complex machines consisting of numerous components and a large number of bearing locations, such engines are unsuitable for a detailed evaluation of basic failure characteristics. Moreover, it is costly and time consuming to provoke bearing failure. Therefore, detailed investigations have been performed using a hydrodynamic bearing test rig to improve understanding of the system. In addition to the standard measurement equipment, advanced systems as described in Section 2.3 have been tested accompanied by a validated test rig simulation model.
3.1 Miba test rig equipment
Figure 12 shows the general setup of the Miba test rig used for the investigations. The construction is kept as simple as possible for easy and quick assembly and rebuilding. To avoid subsequent damage to the drive train system in case of provoked seizure events, a shear pin clutch is installed between the intermediate shaft and the edrive, which is not depicted in Figure 12.
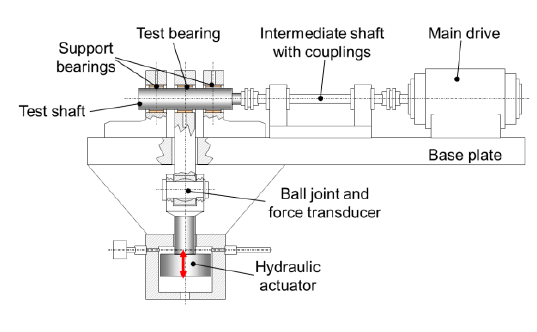
Figure 12. Scheme of Miba bearing test rig
Table 1 below lists the main specification parameters of the test rig, defining the bearing testing boundary conditions. The rig has been designed to run engine-like p-v levels with typical load frequencies and an oil conditioning system capable of achieving the relevant oil temperature, pressure, and flow rate levels.
Table 1. Test rig specification
| Test rig parameters | Values | Units |
|---|---|---|
| Shaft diameter | 65–85 | mm |
| Rotation speed | 25–7500 | rpm |
| Sliding velocity | 0.1–30 | m/s |
| Drive torque | 0–420 | Nm |
| Load | 0–600 | kN |
| Load frequency | 0–50 | Hz |
| Oil inlet temperature | 20–170 | °C |
| Oil flow rate | 0–20 | l/min |
State-of-the-art measurement equipment is just as important as the test rig and has to be in place for control and test result interpretation as well as the calibration/validation of simulation models. The standard measurement equipment is listed below in Table 2. The five temperature sensors listed first are the ones used for the so-called test bearing, which is located between two support bearings. These support bearings that take half of the load are equipped with additional temperature sensors.
Table 2. Test rig standard measurement equipment
| Measurement parameter | Units |
|---|---|
| Temperature sensors x 5 | °C |
| Rotation speed | rpm |
| Drive current | A |
| Drive torque | Nm |
| Load | kN |
| Load frequency | Hz |
| Oil inlet temperature | °C |
| Oil flow rate | l/min |
| Oil pressure | bar |
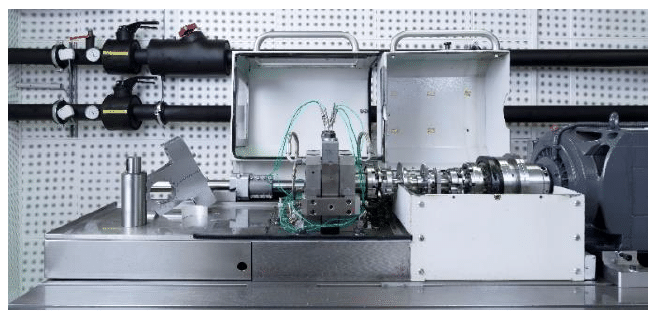
Figure 13. Picture of bearing test rig with open covers
3.2 Bearing rig testing result evaluation and interpretation
A short description of the selected testing programs is necessary for a better understanding of the following result evaluation section. The focus is on the loading level and loading sequence. General boundary conditions were kept constant in the operating range of the test rigs as described in Section 3.1.
So-called “seizure load” tests were chosen to adjust the rig to critical operating conditions; as the name indicates, they terminate with a bearing seizure event. To provoke these events, the load is increased stepwise from 10 to +300 kN (5 to 130 Mpa specific loading). To consider the load sequence as well, a static load and a dynamic load (50 Hz frequency) are combined with the load increase. The standard rig recorder results of static and dynamic seizure load tests are depicted in Figure 14 and Figure 16, respectively.
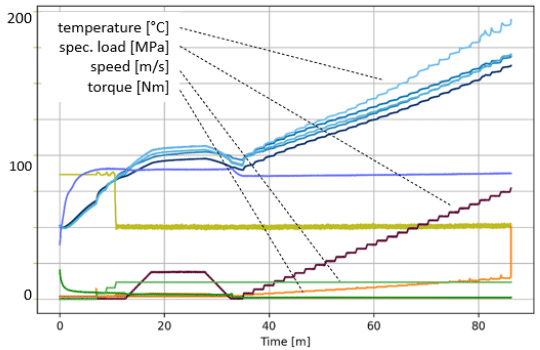
Figure 14. Standard rig recorder measurement results of a static seizure load test
Aside from the standard running-in sequence within the first 30 minutes of operation, the stepwise load increase is clearly visible. In parallel to the load (red), the torque (orange) and temperature (blue) (on the bearing back) show a steady increase in friction power loss. Due to the lower sampling frequency (0,5 Hz) the standard recorder is not able to accurately resolve the seizure event. Therefore, a ring buffer is run in parallel to cover the data in higher sampling frequency (1 kHz), which is shown in Figure 15 for the static seizure load test. Torque (orange) and logically e-drive current (light green) rise dramatically within tenth of a second. The torque gradient is the primary trigger for the termination of the test run. As the temperature rise is a consequence of the mixed friction increase and thermic inertia, the temperature rise (up to +250 °C) marked in blue occurs slightly after the torque peak.
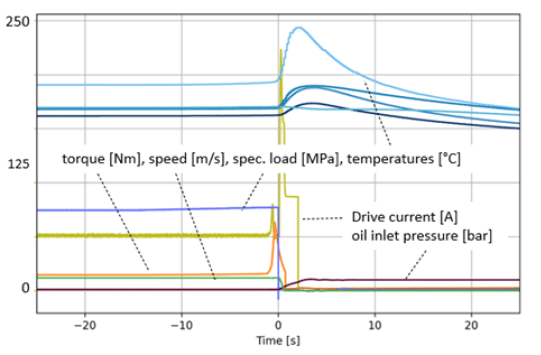
Figure 15. Ring buffer recorder measurement results of a static seizure load test
As shown in Figure 16, the phenomenology is similar in the dynamic seizure load test except that the temperature signals already indicate substantial mixed friction minutes prior to the failure.
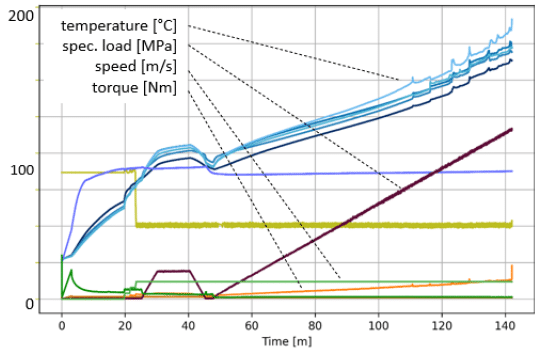
Figure 16. Standard rig recorder measurement results of a dynamic seizure load test
To even better understand bearing behavior, additional measurement equipment has been tested as part of the ongoing research. Based on the measurement techniques listed in Section 2.4., these additional results are interpreted in the following subsection.
3.2.1 Rig result evaluation details
Beside the standard testing recorder data described above, analysis of electrical impedance clearly confirms increased mixed friction ratio as the initiator of the seizure event. For the static seizure load case Figure 17 shows the kmix parameter (described in Section 2.4.1) the last 40 minutes of the run prior to the seizure event. Under low and moderate load, the parameter indicates full hydrodynamic behavior (kmix=100). In line with the load increase, the value drops until the mean value is below 50, when seizure finally occurred.
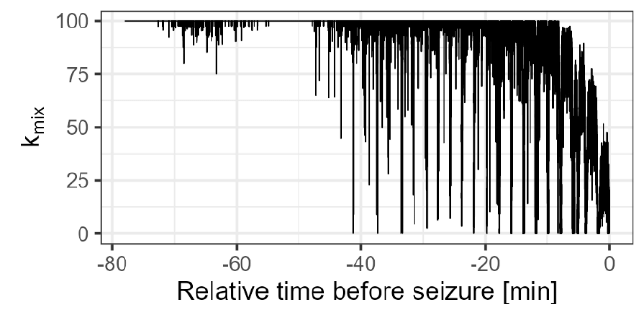
Figure 17. kmix decrease during a static seizure load test
To illustrate the phenomena even better, two short measurement sequences of 0.5 seconds each are shown in Figure 18 and Figure 19. kmix recording detail of a dynamic seizure load test @ 290 kN load point shows a kmix value of 100, which means full hydrodynamic operation.
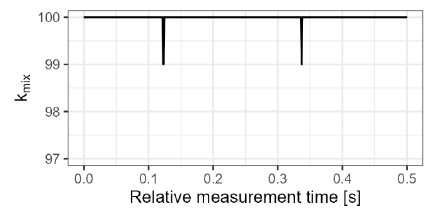
Figure 18. kmix recording detail of a dynamic seizure load test @ 110 kN load
In contrast, the 290 kN sequence indicates a huge fluctuation in the kmix signal between ~0 and 100 in line with the loading frequency, which confirms significant mixed friction under maximum load.
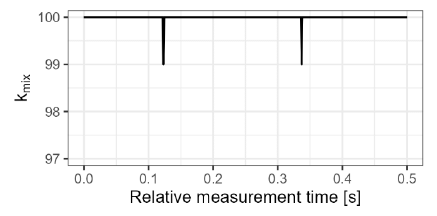
Figure 19. kmix recording detail of a dynamic seizure load test @ 290 kN load
As the seizure event occurred only minutes after this measurement sequence (Figure 19) and in line with the “low” sampling rate measurements shown in Figure 16 and Figure 17, the kmix parameter from the impedance measurement signal seems to be an appropriate indicator for detection of a “critical” bearing operating condition.
Similar to the impedance measurements, the AE signals result in an increased intensity with increasing load. As shown in Figure 20, the mean root mean square (RMS) from continually triggered AE measurements (two second snapshots) during a dynamic seizure test (without running in phase) increase until the seizure event at the end. The RMS standard deviation band further reflects the dynamic loads during the test program.
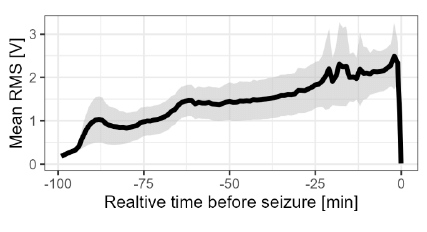
Figure 20. Acoustic emission intensity increase during dynamic seizure tests. The mean RMS values and the ±standard deviation band of the RMS values were obtained with the Kistler 8152C AE sensor (repeated measurements triggered, each recording for two seconds).
As shown in Figure 21, the AE sensor measurements correlate with dynamically applied load changes at a 50 Hz frequency. The different RMS levels of the two temporally high-sampling frequency measurements again show the increasing intensity of the AE signal as the dynamic load increases (cf. Figure 20). Although the oil gap pressure measurements basically correlate with the AE signals, the values are not as expected. On the one hand, the magnitude of the measured values and the detailed shape of the curves are not comparable to the simulation prediction, which resulted in maximum pressures over 100 MPa higher (cf. Section 3.2.2). On the other hand, the pressure appears higher when less load is applied, which contradicts the inherent physical reasoning. The underlying causes of these ambiguous outcomes must still be definitively ascertained and are presently the focus of detailed investigations. Potential explanations encompass unexplained effects at the oil gap pressure measurement position; damping effects due to air pockets, the oil film, or the screw mounting of the pressure sensor (particularly at high load levels); or unrecognized equipment malfunctions.
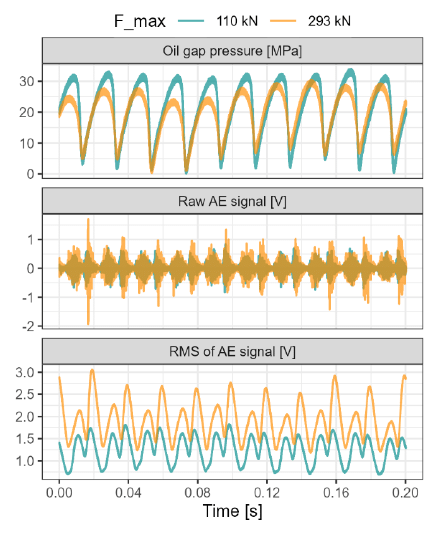
Figure 21. Comparison of acoustic emission measurements (Kistler 8152C) and oil gap pressure measurements (Piezocryst H-series) at two max. load levels during a dynamic seizure test
When a fast-response temperature sensor is installed instead of the oil gap pressure sensor, the temperature on the bearing surface can be compared with standard temperature measurements at the bearing. As shown in Figure 22, the bearing surface measurements correlate with the bearing back measurements and the average surface temperature is of comparable magnitude. In addition, the bearing temperatures correlate with the oil temperature levels and the (dynamic) load applied to the bearing. This again demonstrates the potential of rather simple bearing temperature measurements for bearing CM.
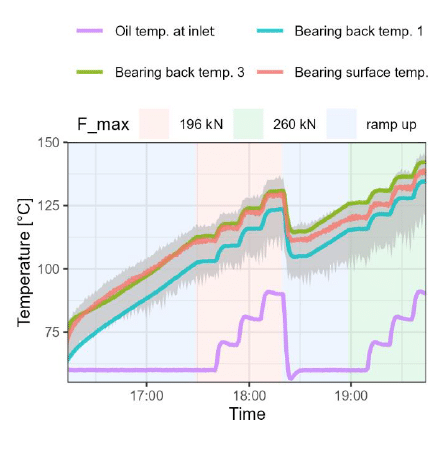
Figure 22. Fast temperature measurement at the bearing surface (mean with 5% and 95% temperature percentiles during load cycles in gray) and two standard bearing back temperature measurements
Due to an issue with the internal contacting of the BEAROMOS device, no meaningful measurement data has been obtained during this measurement campaign.
3.2.2 Rig simulation validation
A detailed simulation model of the rig setup was created that includes a basic static (structural) deformation and a dynamic (modal) analysis to cover all relevant influence factors prior to the EHD model, providing the dynamic response of the rig under cyclic loading. The hydrodynamic validation of the simulation model has previously been performed using post-testing inspections of bearing wear contour, temperature, and torque comparison. Reliable oil film thickness and peak oil film pressure measurements could not be achieved until now. In accordance with the signal analysis for the dynamic seizure load test @100 and 290kN, some major results of the EHD simulations are depicted in Figure 25 to Figure 27. Before looking at the details, Figure 23 gives a general impression of the oil film thickness distribution on the test rig with the main driver being shaft bending, which results in a significant edge contact (without considering any running-in phenomena) that increases with load.
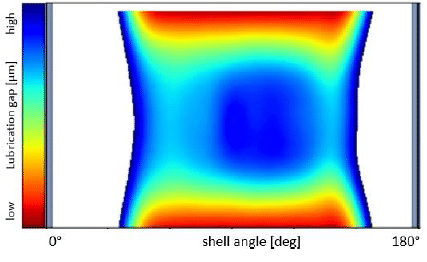
Figure 23. Test rig EHD simulation result of oil film thickness at 290 kN load
When the situation between 110 and 290 kN is compared, the evaluation of the asperity friction power loss again confirms the major difference as visible in Figure 24.
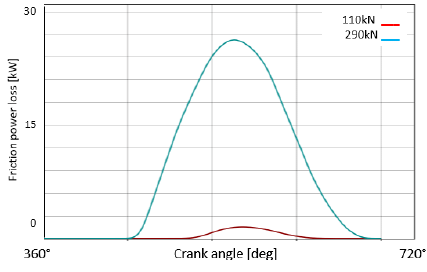
Figure 24. Test rig simulation: Asperity friction power loss for 110 kN and 290 kN load in a single loading cycle of a dynamic seizure load test.
However, it is important to note that the absolute values of the asperity friction power loss are not representative for the simulation comparison, as the initial bearing geometry does not account for any running-in processes. In addition, the influence of the roughness and hardness of the materials is dominant; they are only modeled statistically.
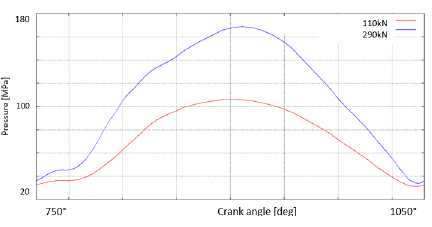
Figure 25. Test rig simulation, Hydrodynamic pressure on 90° shell angle position for 110 kN and 290 kN load
In contrast to the force increase of ~260% (110 to 290kN), the oil film pressure in the bearing center increases by just 70% (shown in Figure 25) as a consequence of the deformation driven pressure distribution change, especially in the axial direction. At higher load, the edge contact starts to become more prominent and carries a higher percentage of the total force (see also Figure 23). After full breakin of the system, i.e., in the fully hydrodynamic regime, the distribution will change again.
4 MCE BEARING SYSTEM MONITORING
Promising sliding bearing monitoring concepts that have been selected based on the results from fundamental bearing test rig investigations will be tested in a real multicylinder engine (MCE) environment for their ability to deliver significant information about the condition of bearings, for example conrod big end bearings and crankshaft main bearings.
4.1 MCE test setup and environment
Engine tests will be carried out at the Large Engines Competence Center’s (LEC) MCE test bed. The specific test setup for this study consists of a test engine that is connected to a “tandem” brake system comprising a water brake and an electric dynamometer, cf. Figure 26. With a nominal brake power of 3.2 MW, the water brake is only capable of converting mechanical energy from the engine into heat. The electric dynamometer can convert mechanical energy from the engine into electric energy and vice versa and thus act as both a brake and a motor for the test engine with a nominal power of 660 kW. In total, the tandem brake setup is capable of providing a brake power of up to 3.86 MW (at a brake torque of up to 20 kNm). The test bed building services include systems for supplying the required fuel and releasing the exhaust gas via a chimney system. Waste heat generated by the engine can be either fed into the local district heating system or dissipated via heat exchangers on the roof of the building, depending on demand. The current test bed setup permits efficient investigation of a multitude of different combustion concepts: from natural gas to diesel operation to operation with alternative sustainable fuels such as hydrogen and methanol.
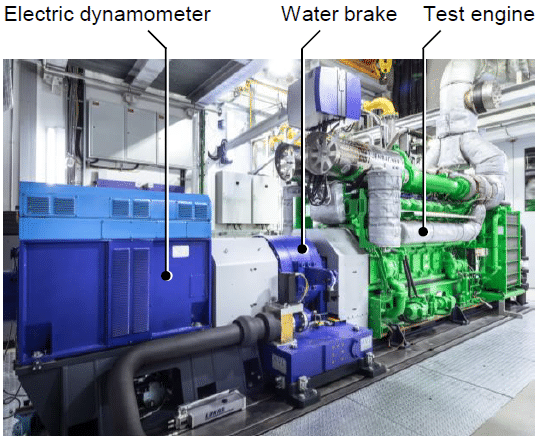
Figure 26. Multicylinder engine (MCE) test bed at the Large Engines Competence Center (LEC)
The specific MCE employed as a test engine for bearing monitoring investigations is a large highspeed 12-cylinder V60° natural gas-fueled Jenbacher engine manufactured by INNIO Group whose technical specifications are presented in Table 3.
Table 3. Technical specifications of the test engine
| Parameter | Value |
|---|---|
| Manufacturer | INNIO Group |
| Engine type | J612 |
| Engine layout | V12, 60° bank angle |
| Displacement | 74.9 dm³ |
| Bore × stroke | 190 × 220 mm |
| Rated speed | 1500 min⁻¹ |
| Rated power | 2.245 MW |
| Fuel | Natural gas (H₂ ready) |
| Turbocharging | Single stage with intercooling |
The test bed is equipped with the latest crank angle-based and time-based measurement systems to monitor and acquire all important measurement parameters from the test engine itself as well as relevant related systems. Standard crank angle-based measurement parameters include the cylinder pressure of all twelve cylinders and the pressures in the intake and exhaust manifolds at selected positions. Combustion parameters such as indicated mean effective pressure (IMEP), peak cylinder pressure and combustion phasing can be derived from the in-cylinder pressure traces in particular. Standard time-based measurement parameters comprise engine speed and torque at the crankshaft, allowing accurate determination of brake power
and brake mean effective pressure (BMEP). Additional parameters include various temperatures, pressures, and mass flows of relevant operating media such as intake air, fuel, coolant, and lubricant oil. The engine friction mean effective pressure (FMEP) can be calculated as the difference between IMEP and BMEP.
4.2 Advanced measurement technology for MCE condition detection
Besides the standard measurement technology described above, it is foreseen to instrument the test engine with special measurement technology specifically targeting detection of bearing condition. In general, the conrod bearings are considered the most relevant bearings for CM since they are subjected to the most challenging conditions. A conrod bearing has to support the full load of the corresponding cylinder while two neighboring crankshaft main bearings usually share the momentary load applied by the cylinder to the crankpin between them. However, measurement parameters obtained from the conrod bearings require special attention due to conrod movement during engine operation. Since it is not possible to connect wires from sensors mounted on connecting rods to data acquisition modules, wireless data transmission with a telemetry system is mandatory.
4.2.1 Temperatures at the conrod bearings
In a manner similar to SCE (single-cylinder engine) tests performed and described in the 2023 CIMAC congress paper 023 [13], two connecting rods on the LEC J612 MCE will be equipped with telemetric units for bearing temperature monitoring. As the system illustrated in Figure 27 is powered by induction, “infinite” monitoring is generally possible beyond specific temporary development tasks.
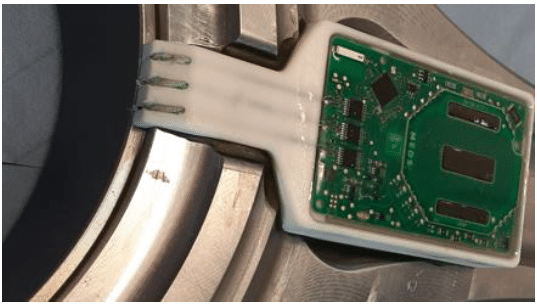
Figure 27. Picture of the Miba telemetric system with 3 thermocouples mounted on a HiPo engine connecting rod
The general feasibility of the system on an MCE platform was proven during 2024. As these measurements on different conrods yielded reliable
data with minor offset, the development of approaches for diagnosis will be a focus of the upcoming measurement campaign.
4.2.2 Sound emission at the liner or the engine crankcase
In contrast to the installation and powering effort of telemetric systems, sound emission measurement devices are relatively easy to physically install on the engine. However, data acquisition and processing pose a substantial challenge due to the vast amounts of data generated at high sampling rates. In addition, the significance of the data generated will likely depend on the number and location of the installed sensors. It may potentially be possible to diagnose a mixed friction event but not to locate its origin with precision.
4.2.3 BEAROMOS system at the free end of the crankshaft
As explained in Section 2.4.4 and illustrated in Figure 11, the BEAROMOS mixed friction detection system can be used on an MCE setup and mounted on the free crankshaft end. In contrast to the other detection systems, no additional sealing of the shaft to the case is needed. The system is able to detect a mixed friction state without a location resolution. The accuracy of the system will be validated as part of ongoing research.
4.2.4 Measurement system limitations
The previously described advanced measurement systems for detecting bearing health condition have pros and cons, i.e., the complexity of installation, data acquisition and processing, and the accuracy of position location. Furthermore, some systems may not be used on large bore ICE applications as adequate electrical insulation of the shaft is impossible or installation space is nonexistent. In addition, the aspect of cost cannot be ignored in development projects. Nonetheless, subsystem validations accompanied by simulation models are clearly the learning vehicles for the use of minimum critical measurement systems complexity on MCE platforms. The target is improved CM (as described in Section 2.1.) in combination with engine specific simulation models and adequate ML approaches.
4.3 Machine learning for MCE condition monitoring approaches
For MCE bearings CM systems, data-driven approaches from the field of artificial intelligence and in particular its subfield machine learning (ML) are considered promising for assessing and modeling correlations inherent to databases. They can be used in various ways for condition detection, comparison, and diagnosis tasks [2].
Since measurement data from the LEC J612 MCE with bearing-specific instrumentation is not yet available, a CM approach for crankshaft main bearings based on previous research is presented to illustrate the potential of an ML approach [1]. Crankshaft main bearing temperatures on a heavy-duty in-line six-cylinder truck engine were measured with thermocouples. As observed during bearing rig testing, the bearing temperature—even when not measured directly at the surface—is seen as a reliable and fast-reacting indicator of mixed friction. Various engine operating parameters such as load, speed, oil temperature, and oil pressure were varied to investigate their impact on the main bearing temperatures. The corresponding measurement database was then used to set up a data-driven bearing temperature reference model that predicts bearing temperature as a function of relevant engine operating parameters during failure-free operation. The best model obtained was based on support vector regression (SVR) with a radial basis kernel. Tested on previously unseen data, it was capable of predicting the bearing temperature with a mean absolute error of less than 0.3°C, cf. Figure 28. In the temperature range from approximately 76°C to 112°C, the results are highly accurate. Therefore, the bearing temperature model is found to be suitable as a reference during condition comparison since even small discrepancies between the model result and the measured values can provide valuable information about anomalies in bearing condition.
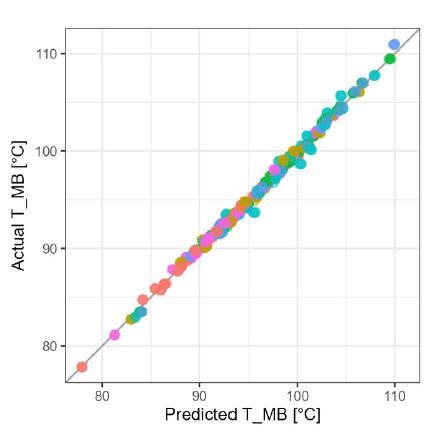
Figure 28. Graphical analysis of main bearing temperature (T_MB) predictions of previously unseen data. Colors depict the different bearing locations
It is expected that ML will also be a valuable tool for tackling specific condition detection, comparison, and diagnosis tasks on the J612 test engine utilized in the current research. For example, ML can be used for the data processing required to efficiently analyze multiple AE measurements at different locations on the engine and then to correlate these measurements with other measurement technologies used. This will be investigated in detail as soon as advanced bearing-specific measurement data from the test engine is available.
4.4 EHD bearing simulation model of J612
An adequate EHD bearing simulation model was set up to obtain information from the MCE bearing system that cannot be measured on the real test engine. On the one hand, this model can help improve the general understanding of bearing behavior on the investigated test engine. On the other hand, this information can be used to enhance the interpretation of measurement data from the test engine and thus facilitate advanced condition detection approaches. The basic EHD simulation approach for the bearing test rig that was validated based on related measurements was also used for the J612 test engine; Figure 29 illustrates the simulated oil film pressure at one crankpin and at the neighboring main bearings. It is expected that this model can also accurately simulate oil film thickness and mixed friction behavior during run-in and predict the bearing temperature at steady-state operating conditions. However, adequate validation of the MCE EHD model based on MCE measurement data is currently pending.
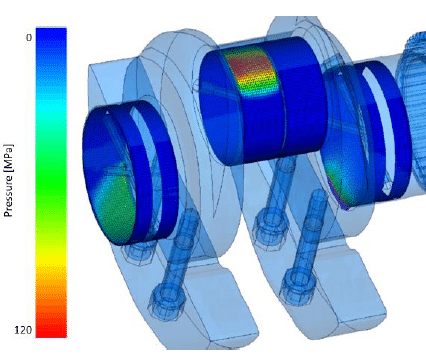
Figure 29. EHD peak total pressure of MB 1-2 and crank pin 1 @ PFP of cylinder 7
As explained in Section 3, different “advanced” measurement equipment have been tested and validated on the bearing test rig to obtain a more
detailed understanding of the hydrodynamic system. This is necessary in order to improve the prediction quality of the bearing functionality on the MCE level because all the measurement equipment tested on the rig cannot be applied there. In addition, some of the systems capable for such an MCE installation (e.g., the BEAROMOS system) will detect a general state of the overall bearing functionality, without enabling identification of specific bearing locations. Therefore, physical models and statistical algorithms will be needed in combination with general and bearing-specific measurement tools to improve bearing condition monitoring.
5 BUSINESS CONSIDERATIONS
In addition to the technical limitations to installing measurement equipment and the proof of the reliability on MCEs, the costs have to be considered, which goes beyond the scope of development projects. In the end, the additional effort has to be justified by an added value/promising business case.Therefore, the so-called high-speed engine segment over a time span of 20 years has been examined and Miba sales volumes and estimated bearing reliability (for main and conrod BEBs only) considered. Two scenarios have been evaluated with regard to different application and market boundaries. Mean reliability costs after a bearing failure induced engine damage, including engine repair and down time costs, have also been taken into account. In the case of additional monitoring equipment, these reliability costs—50% engine failure, 50% bearing failure without subsequent damages—have been split. The costs for replacing bearings only are seen as 10% (parts & work force) of the full engine overhaul costs.
- “Volume” market: When all “high speed” engines with moderate load (<20bar BMEP) and reported bearing failures are taken into consideration, the main and BEB systems are more than 99.995% reliable. A breakdown in savings on reliability costs as described above indicates a value of €~10 per bearing location or only €200–500 per engine.
- “Edge” and pre-serial applications: The engines with maximum power to weight ratio (BMEP >20bar) and pre-serial applications are more sensitive, resulting in a lower reliability of 99.95% to 99.9%. As pre-serial applications normally go hand in hand with higher production costs, the engine damage repair costs are higher as well. Following the same logic as before, the breakdown of the reliability cost savings per bearing unit indicate values of
€120–400, or €3,000–12,000 per engine unit, strongly dependent on the specific case.
Despite the global view on engine failure rates, the estimates of reliability costs, and possible savings using additional condition monitoring systems, the statement is rather clear. As the total cost of ownership (TCO) for additional measurement equipment per bearing unit will be around €200, in up to medium performance engine series as described in scenario 1, sophisticated measurement systems especially on bearing position level are unattractive from a commercial point of view. In contrast, advanced measurement tools accompanied by enhanced CM systems and simulation models for “edge” and pre-serial applications (scenario 2) will pay off in most cases.
6 CONCLUSION AND OUTLOOK
As the research that serves as the basis for this paper is still ongoing, the findings explained here are preliminary. Although validation on the J612F MCE has not started yet and the test rig data processing and validation is still in progress, valuable information as described below has already been deduced. An improvement in our understanding of the sliding bearing system using advanced measurement techniques such as electrical impedance, sound emission, and pressure sensors has already been achieved. Other promising outcomes of the ongoing research are:
• The refinement of simulation models and adequate model validation based on the subscale sliding bearing rig testing setup
• The setup and calibration of a EHD simulation model for a large bore high-speed MCE
• A framework for enhanced failure prediction methodologies for sliding bearings in HSLEs
• Knowledge build-up concerning the use and functionality of specific measurement systems for sliding bearing monitoring
As mentioned above, all the monitoring equipment tested on the sliding bearing rig cannot be used on the MCE unit. However, the 7 MBs and 12 BEBs on the MCE test engine make it possible to combine physical value measurements such as specific temperatures, sound emission, and mixed friction detection with data-driven algorithms. This combination, when augmented by insights derived from enhanced physical models, suggests the feasibility of predicting sliding bearing failures. This, in turn, has the potential to prevent damage to secondary components and minimize the necessity for reliability initiatives.
7 DEFINITIONS, ACRONYMS, ABBREVIATIONS
ICE: internal combustion engine
SCE: Single-cylinder engine
MCE: Multicylinder engine
HSLE: High-speed large engine
MB: Main bearing
BEB: Big end bearing
BMEP: Break mean effective pressure
PFP: Peak firing pressure
MBD: Multibody dynamics
EHD: Elasto-hydrodynamic
LEC: Large Engine Competence Center
GETS: Green energy and transport systems
REB: Roller element bearing
CM: Condition monitoring
AE: Acoustic emission
ML: Machine learning
CBM: Condition-based maintenance
PdM: Predictive maintenance
TCO: Total cost of ownership
8 ACKNOWLEDGMENTS
The authors would like to acknowledge the financial support of the “COMET – Competence Centers for Excellent Technologies” Program of the Austrian Federal Ministry for Climate Action, Environment, Energy, Mobility, Innovation and Technology (BMK) and the Austrian Federal Ministry of Labor and Economy (BMAW) and the Provinces of Salzburg, Styria and Tyrol for the COMET Centre (K1) LEC GETS. The COMET Program is managed by the Austrian Research Promotion Agency (FFG).
9 REFERENCES AND BIBLIOGRAPHY
[1] Laubichler, C., Kiesling, C., Marques da Silva, M., Wimmer, A. and Hager, G. 2022. Data-Driven Sliding Bearing Temperature Model for Condition Monitoring in Internal Combustion Engines. Lubricants. 10, 103.
[2] Kiesling, C., Laubichler, C., Pirker, G., Posch, S. and Wohlthan, M. 2023. Enhancement of Large Engine Technology Through Machine Learning. CIMAC Congress 2023 (Busan, South Korea, 2023).
[3] Miró, G., Tormos, B., Allmaier, H., Sander, D.E. and Knauder, C. 2017. Current trends in ICE wear detection technologies: from lab to field. ASRO Journal of Applied Mechanics. 2, 32–41.
[4] Wan, B., Yang, J. and Sun, S. 2020. A Method for Monitoring Lubrication Conditions of Journal Bearings in a Diesel Engine Based on Contact Potential. Applied Sciences. 10, 5199.
[5] Hager, G., Schallmeiner, S., Nagl, J., Breiteneder, T., Vystejn, J. and Düsing, J.F. 2019. Smart Bearings for Optimized Engine Design and Operation. 17. Tagung Der Arbeitsprozess des Verbrennungsmotors (2019), 328–339.
[6] EN, B. 2017. 13306: 2017; Maintenance—Maintenance Terminology. British Standards Institution: London, UK.
[7] Weck, M. 1983. Werkzeugmaschinen im Wandel — Forderungen der Anwender. Fertigungstechnologie in den neunziger Jahren. Werkzeugmaschinen im Wandel: 298. Sitzung am 7. Juli 1982 in Düsseldorf. VS Verlag für Sozialwissenschaften. 41–79.
[8] Miba 2008. Miba bearing manual Ver. 2008.
[9] Prölß, M., Schwarze, H., Hagemann, T., Zemella, P. and Winking, P. 2018. Theoretical and Experimental Investigations on Transient Run-Up Procedures of Journal Bearings Including Mixed Friction Conditions. Lubricants. 6, 105.
[10] https://www.maschinenbauwissen.de/skript3/mechanik/kinetik/283-rollreibung. Accessed: 2025-03-21.
[11] https://www.piezocryst.com/produkt/H-Serie. Accessed: 2025-03-21.
[12] Hase, A., Mishina, H. and Wada, M. 2012. Correlation between features of acoustic emission signals and mechanical wear mechanisms. Wear. 292–293, 144–150.
[13] Hager, G., Estebanez, G., Flesch, H., Rustler, M., Reisenberger, J. and Lahner, D. 2023. Joint development of the bearing system for AVL’s new high-speed engine platform. CIMAC Congress 2023 (Busan, South Korea, 2023).
10 CONTACT
Dipl.-Ing. Gunther Hager
Miba Gleitlager Austria GmbH
Dr.-Mitterbauer-Str. 3, 4663 Laakirchen, Austria
Email: gunther.hager@miba.com
Phone: +43 664 8863 7475